GPCR-SAS: a web application for statistical analysis on G protein-coupled receptors sequences<
Authors: José Carlos Gómez Tamayo, Mireia Olivella, Santiago Ríos, Marlous Hoogstraat, Angel Gonzalez,
Eduardo Mayol, Xavier Deupi, Mercedes Campillo and Arnau Cordomí.
The G Protein-Coupled Receptors - Sequence Analysis and Statistics (GPCR-SAS) web application
provides a set of tools to perform comparative analysis of sequence positions between receptors,
based on a curated structural-informed multiple sequence alignment. The analysis tools include: (i) frequency
and entropy for one or more amino acids in a sequence position or range, (ii) covariance of two positions,
(iii) correlation between two amino acids in two positions (or two sequence motifs in two range of positions),
and (iv) snake-plot representation for a specific receptor or for the consensus sequence of a group of selected
receptors can be displayed. The analysis of conservation of residues and motifs across transmembrane (TM) segments
is key in the study of ligand and G protein selectivity or family-specific mechanisms of activation.
Laboratori de Medicina Computacional, Universitat Autònoma de Barcelona
Click here to download the currently used sequence alignment in (FASTA format).
| Class | Receptors (all) | Receptors (Human) |
| A | 2456 (1836 non-olfactory) | 718 (292 non-olfactory) |
| B | 205 | 49 |
| C | 111 | 22 |
| F | 297 | 36 |
| Total | 3069 | 825 |
GPCR-SAS can perform 4 different types of statistical analysis dependending on the input. The snakeplot option offers the option of drawing a snakeplot representation. Before running the calculation, a subset of GPCRs can be selected by navigating through the classification menus. After running a calculation, updating the classification will update the calculation.
This analysis is performed when only the first input for positions is filled. The input can be completed with a
position ( e.g: 3.50 ), list of positions (not necessary consecutive e.g: 3.40, 5.50, 6.44), and a range of positions (e.g: 3.49-3.51) in
Ballesteros & Weinstein notation.
The result is a list of motifs appearing at selected positions sorted by the conservation, and the entropy

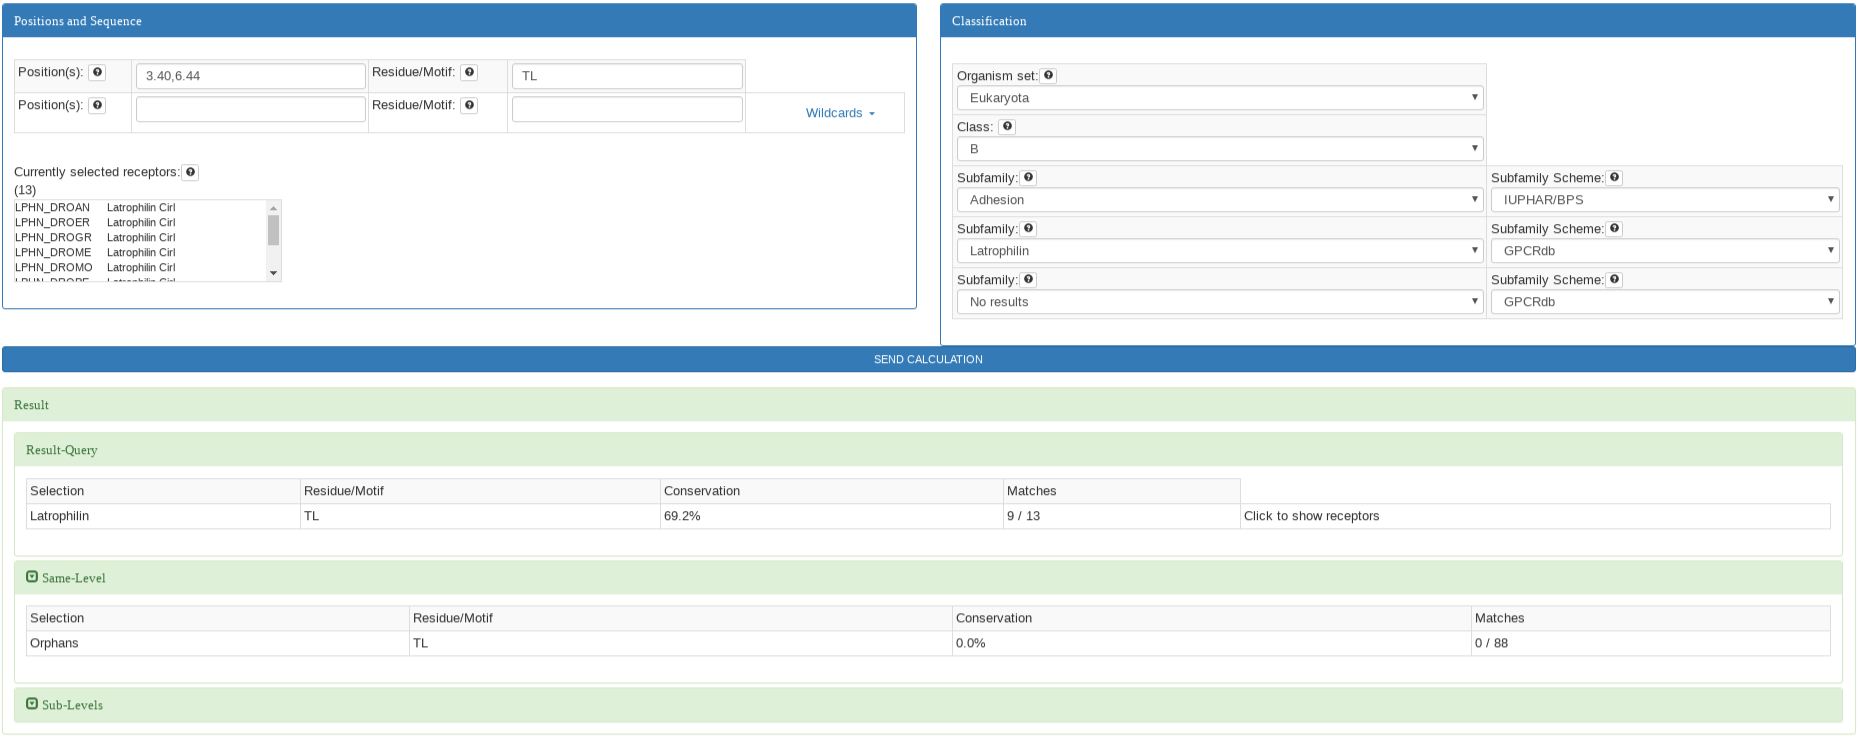
This analysis is performed when the first input for positions and the first input for motif are filled. The position input can be completed with a
position ( e.g: 3.50 ), list of positions (not necessary consecutive e.g: 3.50, 7.43, 5.55), or a range of positions (e.g: 3.49-3.51) in
Ballesteros & Weinstein notation. The motif input must be filled out with the same number of residues as positions in single letter residue code. Wildcards
can be used to select group of residues.
The result is a list of appearing motifs sorted by the conservation. The results for the same classification as well as for the sublevel classification levels are also
calculated and displayed by clicking on the titles.

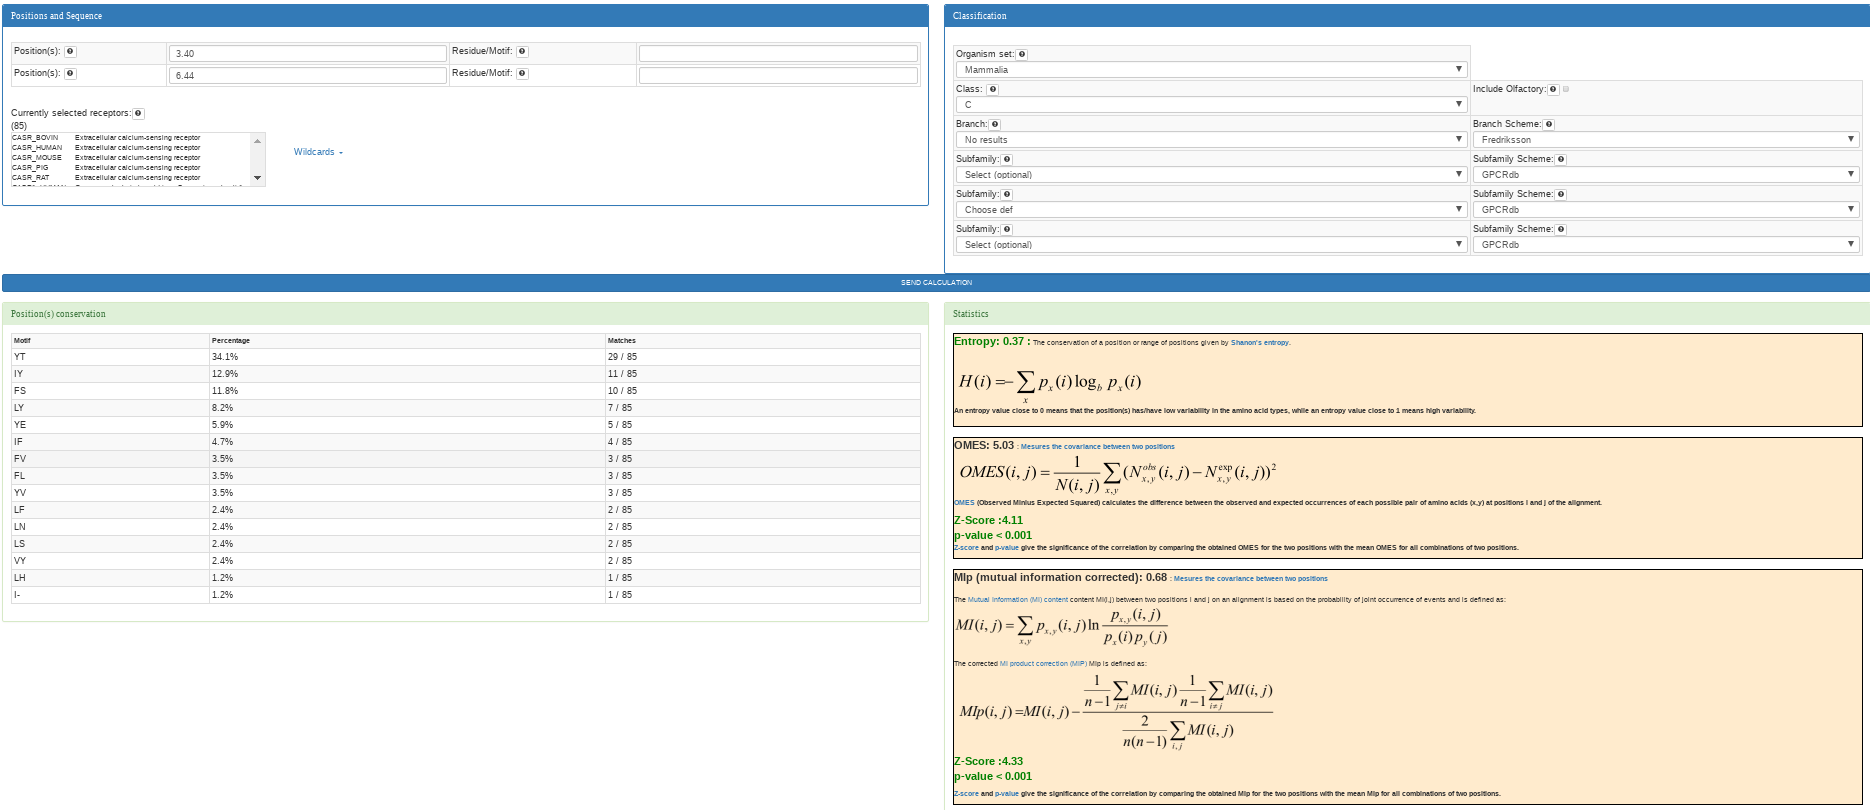
This analysis is performed when the first input and second for positions and the first input for motif are filled out. The position inputs must be completed with a
position (e.g: 3.50) each one in Ballesteros & Weinstein notation.
GPCR-SAS provides both the OMES and the MIp analyses. The result shows the entropy for the two positions, the OMES value (a chi-square (χ²) variant to measure covariance), the MIp value (a corrected mutual information method) both accompained by the associated z-scores and p-values to determine significance.
The calculation might take several seconds depending on the size of the receptors subset as the z-scores and p-values require calculation for all combinations of positions.

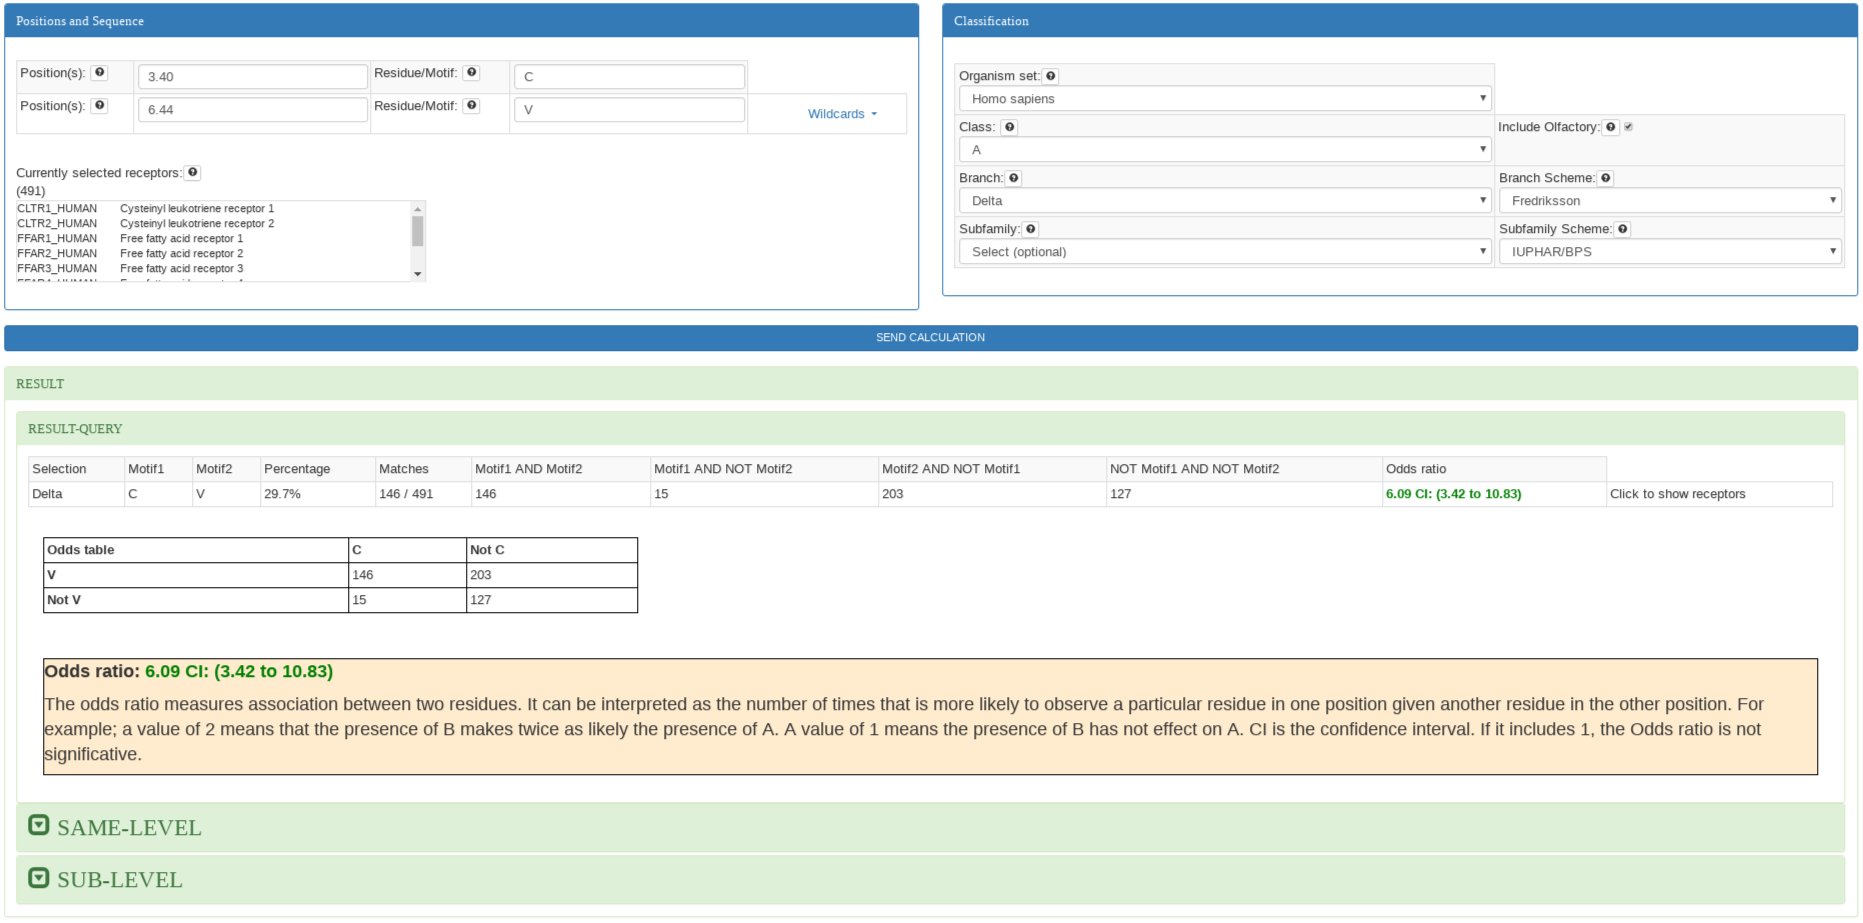
This analysis is performed when all inputs are filled. The position inputs must be completed with a
position (e.g: 3.50), list of positions (not necessary consecutive e.g: 3.50, 7.43, 5.55), or a range of positions (e.g: 3.49-3.51) in Ballesteros & Weinstein notation. The motif inputs must be completed with the same number of residues as positions in single letter residue code. Wildcards
can be used to select group of residues.
The result shows the conservation of the two motifs and the odds ratio. Odds ratio is the ratio of the probability of having a residue in one position given another residue in other position. For example; a value of 2 means that the presence of B
makes twice as likely the presence of A. A value of 1 means the presence of B has not effect on A

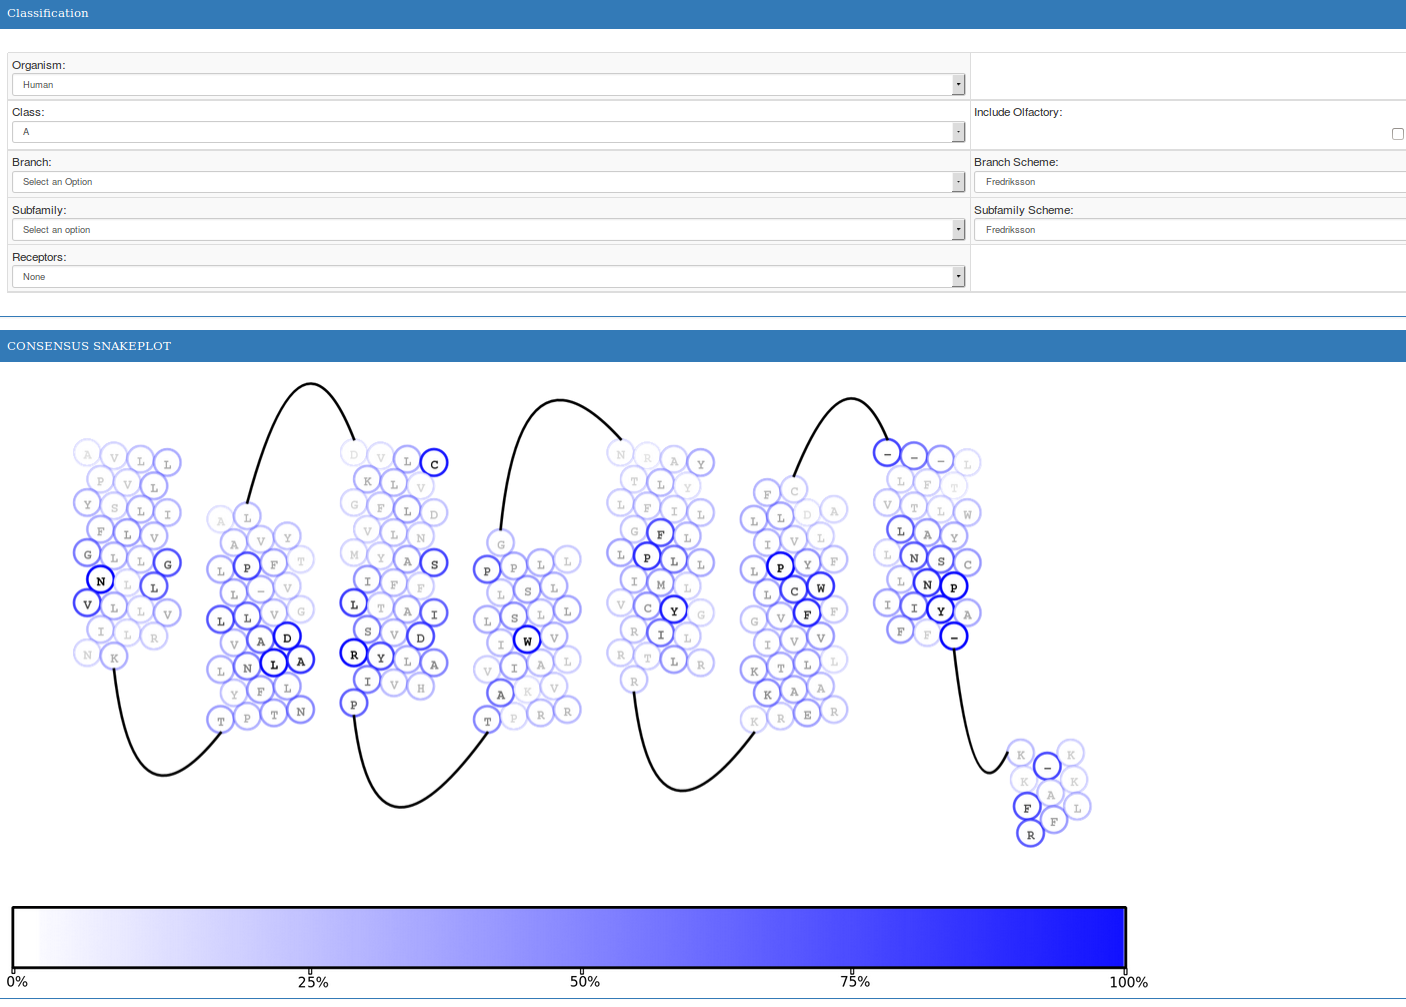
GPCR-SAS also provides snake-plot representations for the sequence of a specific receptor or for the consensus sequence of a group of receptors. Each residue is represented by a circle with a letter in gray-gradient (representing the frequency of the residue on the class) and an outline in blue-gradient (representing the frequency of the residue on the selected group of receptors). In single-receptor snake-plots, residues colored in green are those that do not match the most conserved residue for the selected group of receptors (i.e. the selected subfamily).
